Notebooks
- Data Wrangling
- Feature Engineering
- Exploratory Data Analysis
- Outlier Analysis
- Linear Regression
- Poisson Regression
- Time Series Analysis
- Modeling
- XGBoost
- Model Evaluation
Experiment Tracker
The Data Pipeline was deployed using a combination of AWS services and Streamlit. To delivery predictions, several notebooks were created such as feature engineering and XGBoost modeling to achieve a Normalized Root Mean Square Error (NRMSE) of 0.14699
To keep track of different models tested, an Excel file is created (with help of a Python class to document all versions.
| Experiment Tracker - Sheet Ideas |
| Experiment Tracker - Sheet Experiments |
After Exploratory, Outlier, and Time Series Analyses, a Decision Tree learning algorithm was chosen as primary model type for the experiments.
Modeling
Different supervised algorithms were tested with little feature engineering and XGBoost yields the best results. Check out the Notebook.
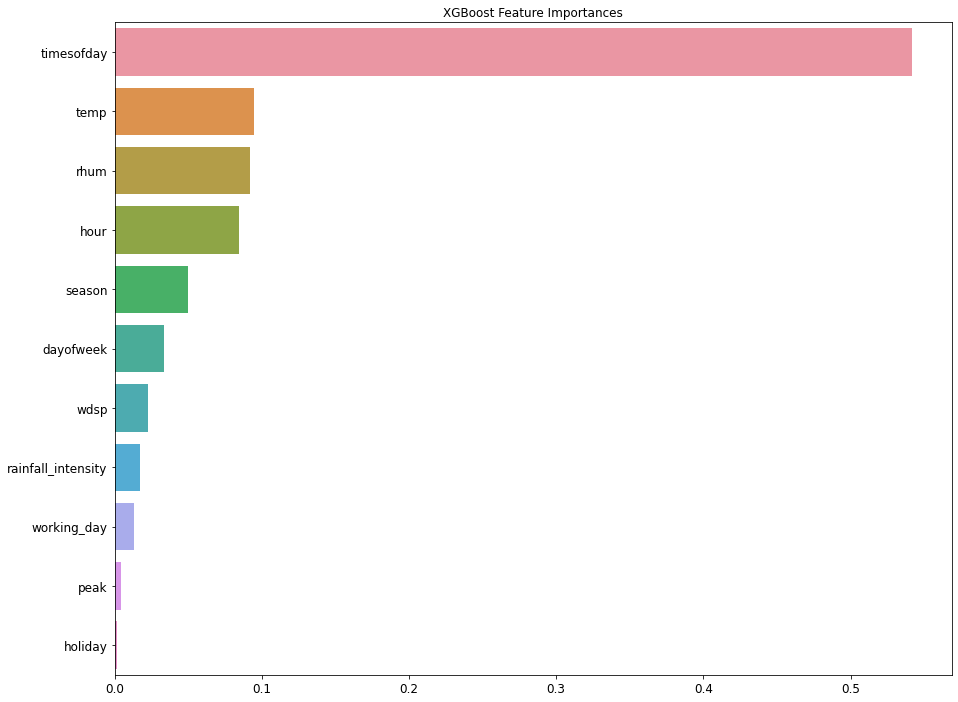 |
|---|
| Feature Importances Plot from XGBoost model |
Several XGBoost models were built and logged with Experiment Tracker Class mentioned above. XGBoost Tracker
Evaluation
Normalized Root Mean Square Error (NRMSE) was the main metric used to evaluate and compare the models.
\[NRMSE = \frac{RSME}{y_{max} - y_{min}}\]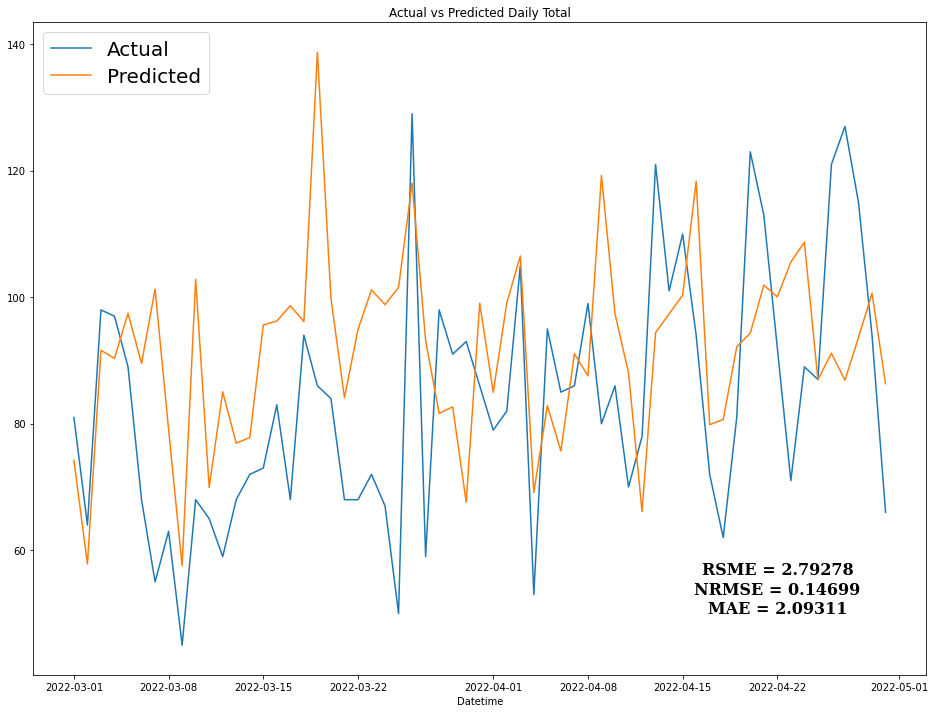 |
|---|
| Daily Rentals Prediction Plot |